28 Working with symbols and glyphs
The JavaScript library underlying plotly (plotly.js) has it’s own special support for specifying marker symbols by name. As Figure 28.1 shows, there are currently many acceptable marker.symbol values, and all the acceptable values can be accessed through plotly.js’ schema().
vals <- schema(F)$traces$scatter$attributes$marker$symbol$values
vals <- grep("-", vals, value = T)
plot_ly() %>%
  add_markers(
    x = rep(1:12, each = 11, length.out = length(vals)),
    y = rep(1:11, times = 12, length.out = length(vals)),
    text = vals,
    hoverinfo = "text",
    marker = list(
      symbol = vals,
      size = 30,
      line = list(
        color = "black",
        width = 2
      )
    )
  )
FIGURE 28.1: All marker symbols currently supported by plotly.
In addition to these marker symbols, you can also use add_text() to encode data with on-graph text. Moreover, the add_text() function (i.e. a scatter trace with mode="markers") enjoys a lot of the same properties as add_markers() (i.e. a scatter trace with mode="text"). As Figure 28.2 shows, similar to how we can supply typographical glyphs and/or unicode in a custom tooltip, you can supply a character vector of similar content to add_text() (i.e. a scatter trace with mode='text') which renders on-graph text. Furthermore, when using text to render on-graph text, one can leverage the hovertext attribute to display some different text on hover.
plot_ly() %>%
  add_text(
    x = rep(2, 2),
    y = 1:2,
    size = I(15),
    text = c(
      "Glyphs: Ѳ, (╯°□°)╯ ┻━┻",
      "Unicode: \U00AE \U00B6 \U00BF"
    ),
    hovertext = c(
      "glyphs",
      "unicode"
    ),
    textposition = "left center",
    hoverinfo = "text"
  )
FIGURE 28.2: Using add_text() to render on-graph text with typographical glyphs and/or unicode.
Having the ability to encode data with unicode means that we have a virtually endless number of ways to encode data in symbols/glyphs. Just for fun, Figure 28.3 demonstrates how you could plot all the activity emojis using the emo package and display the name of the emoji on hover (Wickham, François, and D’Agostino McGowan 2018).
library(emo)
set.seed(100)
jis %>%
  filter(group == "Activities") %>%
  plot_ly(x = runif(nrow(.)), y = runif(nrow(.))) %>%
  add_text(
    text = ~emoji,
    hovertext = ~name,
    hoverinfo = "text",
    size = I(20)
  )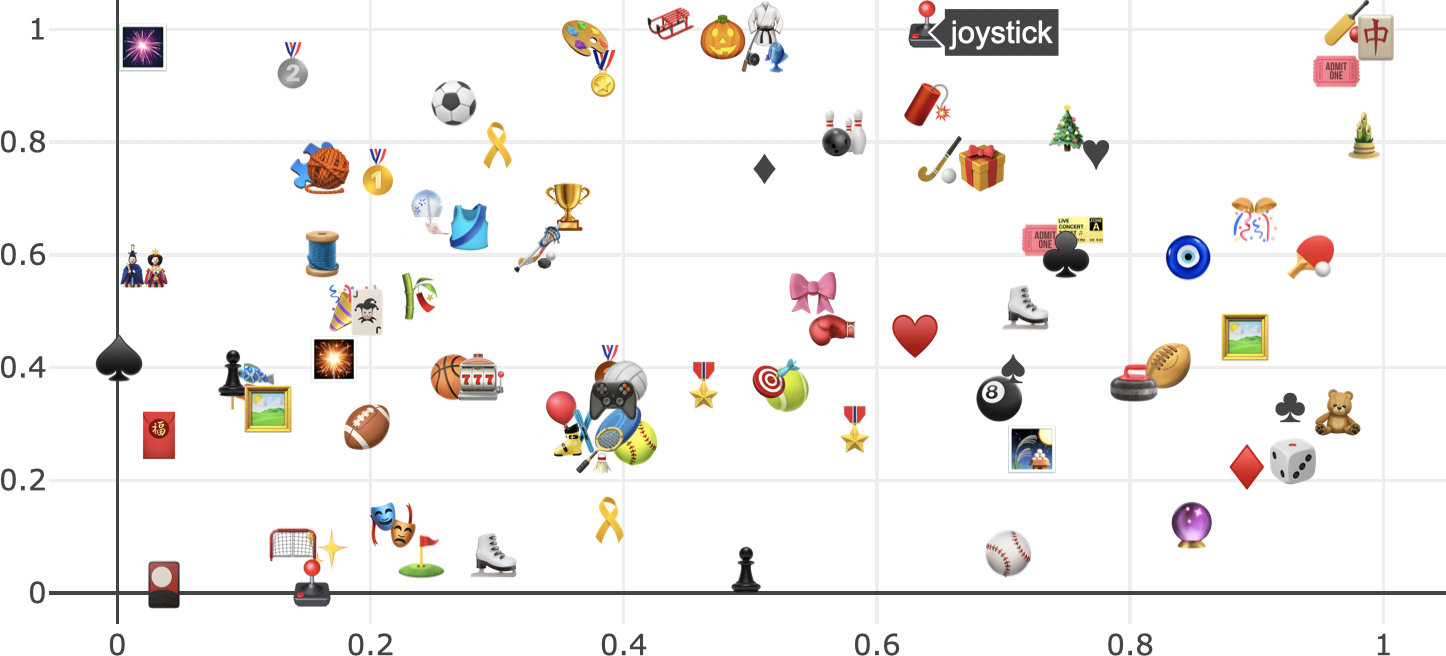
FIGURE 28.3: Using add_text() to plot all the activity emojis and leveraging hovertext to place the emoji names in the tooltip text.
References
Wickham, Hadley, Romain François, and Lucy D’Agostino McGowan. 2018. Emo: Easily Insert ’Emoji’. https://github.com/hadley/emo.